It’s time for one of those bug’s story. This one was introduced earlier but it’s related to “The story of the 20 million queries per hour”, not a consequence of that mistake, but it shares some related context.
Introduction
If you work with a custom-made eCommerce platform, you probably use some kind of exchange rate API. This is useful to avoid maintaining your own list, and instead, rely on a 3rd party service such as Open Exchange Rates ⧉ (not affiliated) to handle conversions for you. For example, the exchange rate from USD to MXN.
When your platform grows in instance count, you want to be able to handle costs. In services like these, it makes sense to add a cache layer between the API and your server, so you can reduce calls when you scale up and avoid a higher paying tier - it’s also the polite thing to do. What you really pay for these kinds of services is the update window.
API with cache optimization
Let’s assume we have the API integration in place and every time we ask for an exchange rate, we go and fetch the data from the service and use it.
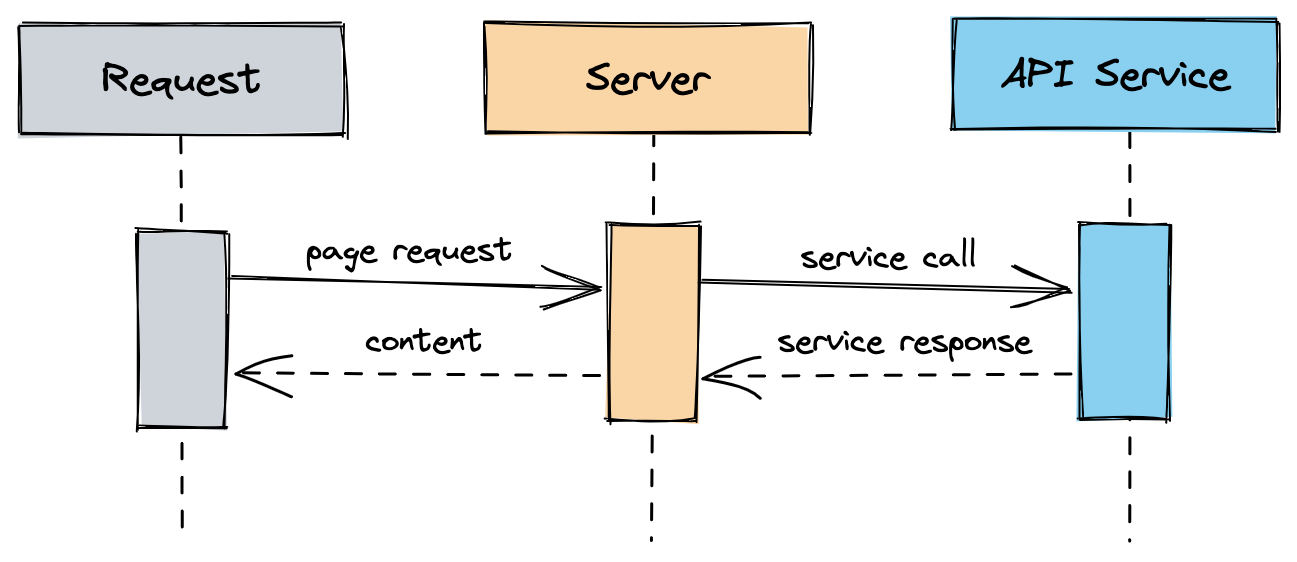
This is expensive since we will need to rely on the uptime of the service, the latency of the network response, and the processing of the data.
So instead of asking for the data every time we ask for an exchange rate, we do it asynchronously and save it in memory in a background job.
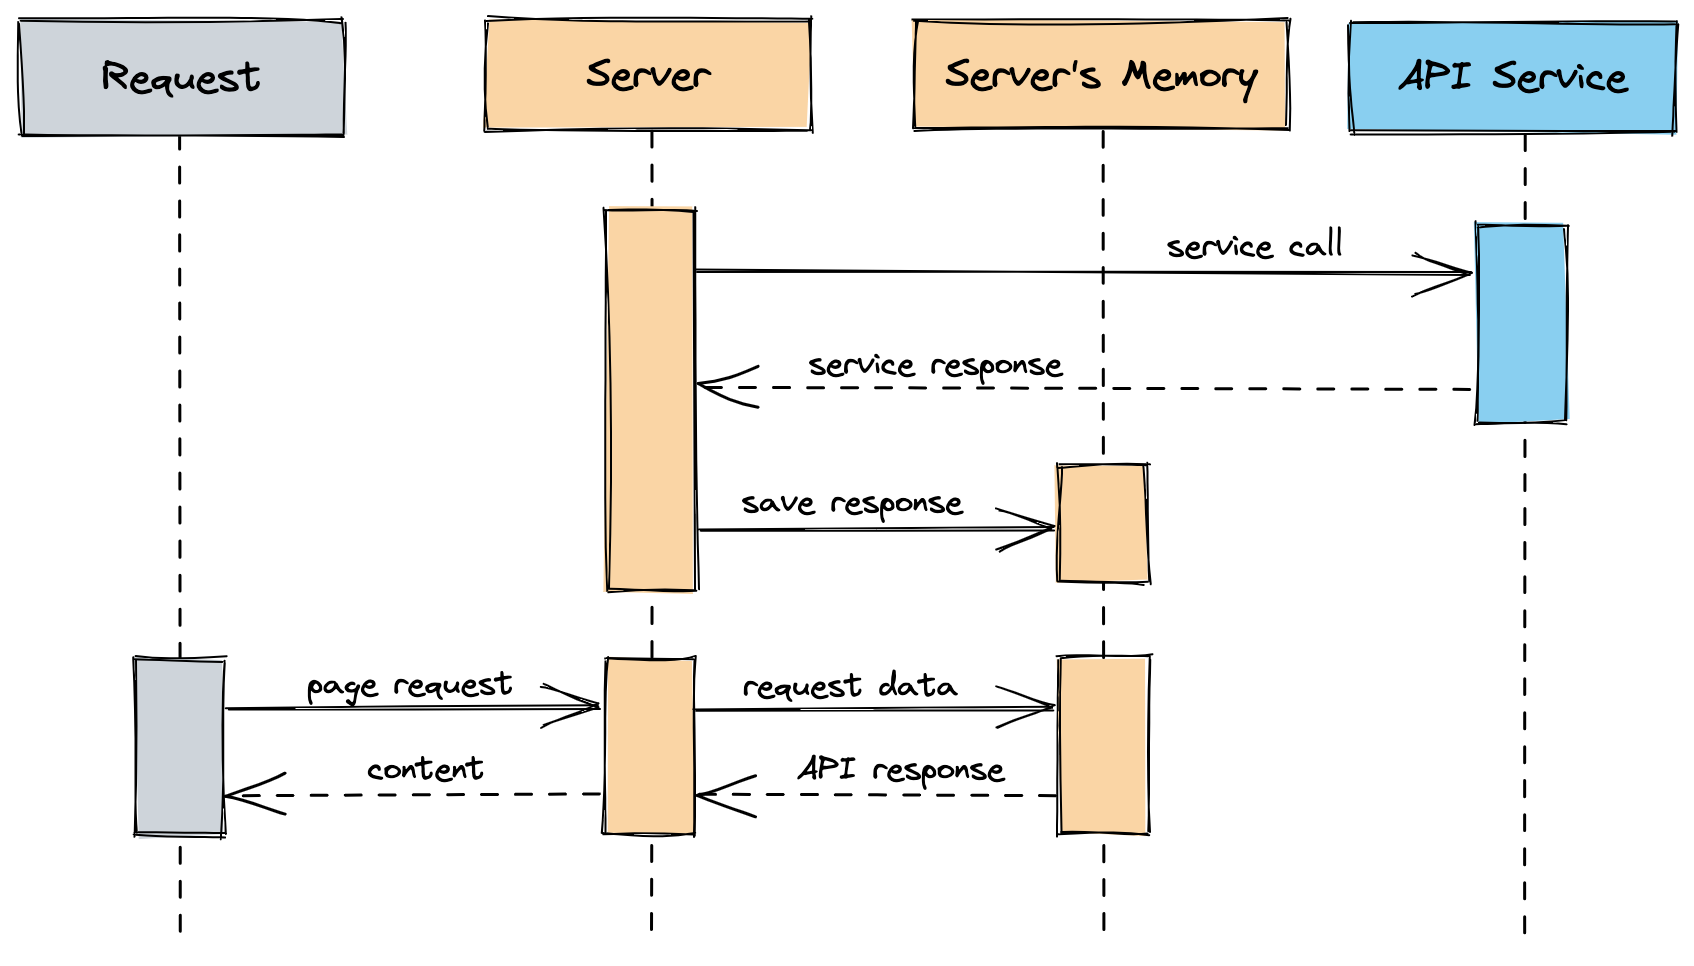
When we ask for the exchange rate, we will read from that memory store instead. Let’s do this every hour so we can keep the data up to date and on boot, so we don’t delay any calls.
Now this works for a while until you start to scale because what happens is that every time a new instance is spawned it will go and fetch the data from the API and save it to memory, and run the background job every hour to keep the data up to date.
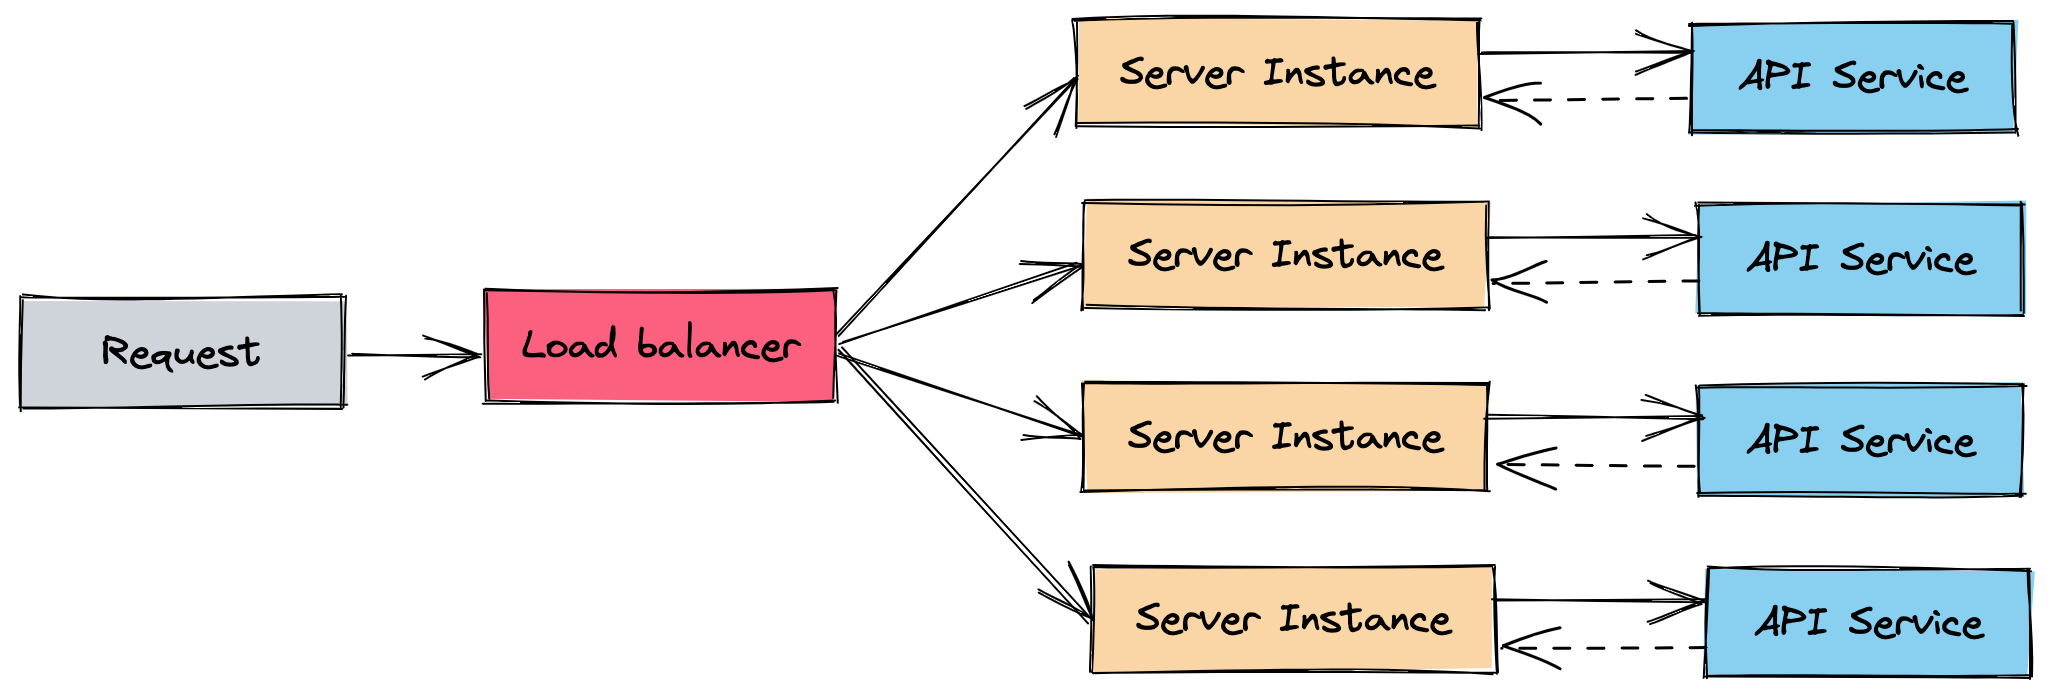
You do this for every machine you spawn so you multiply the API calls you do every hour times the number of instances you have.
Now your API bill is skyrocketing or the calls are being blocked because you’re not within the tier you’re paying, because your business is so successful it needs more and more instances every time.
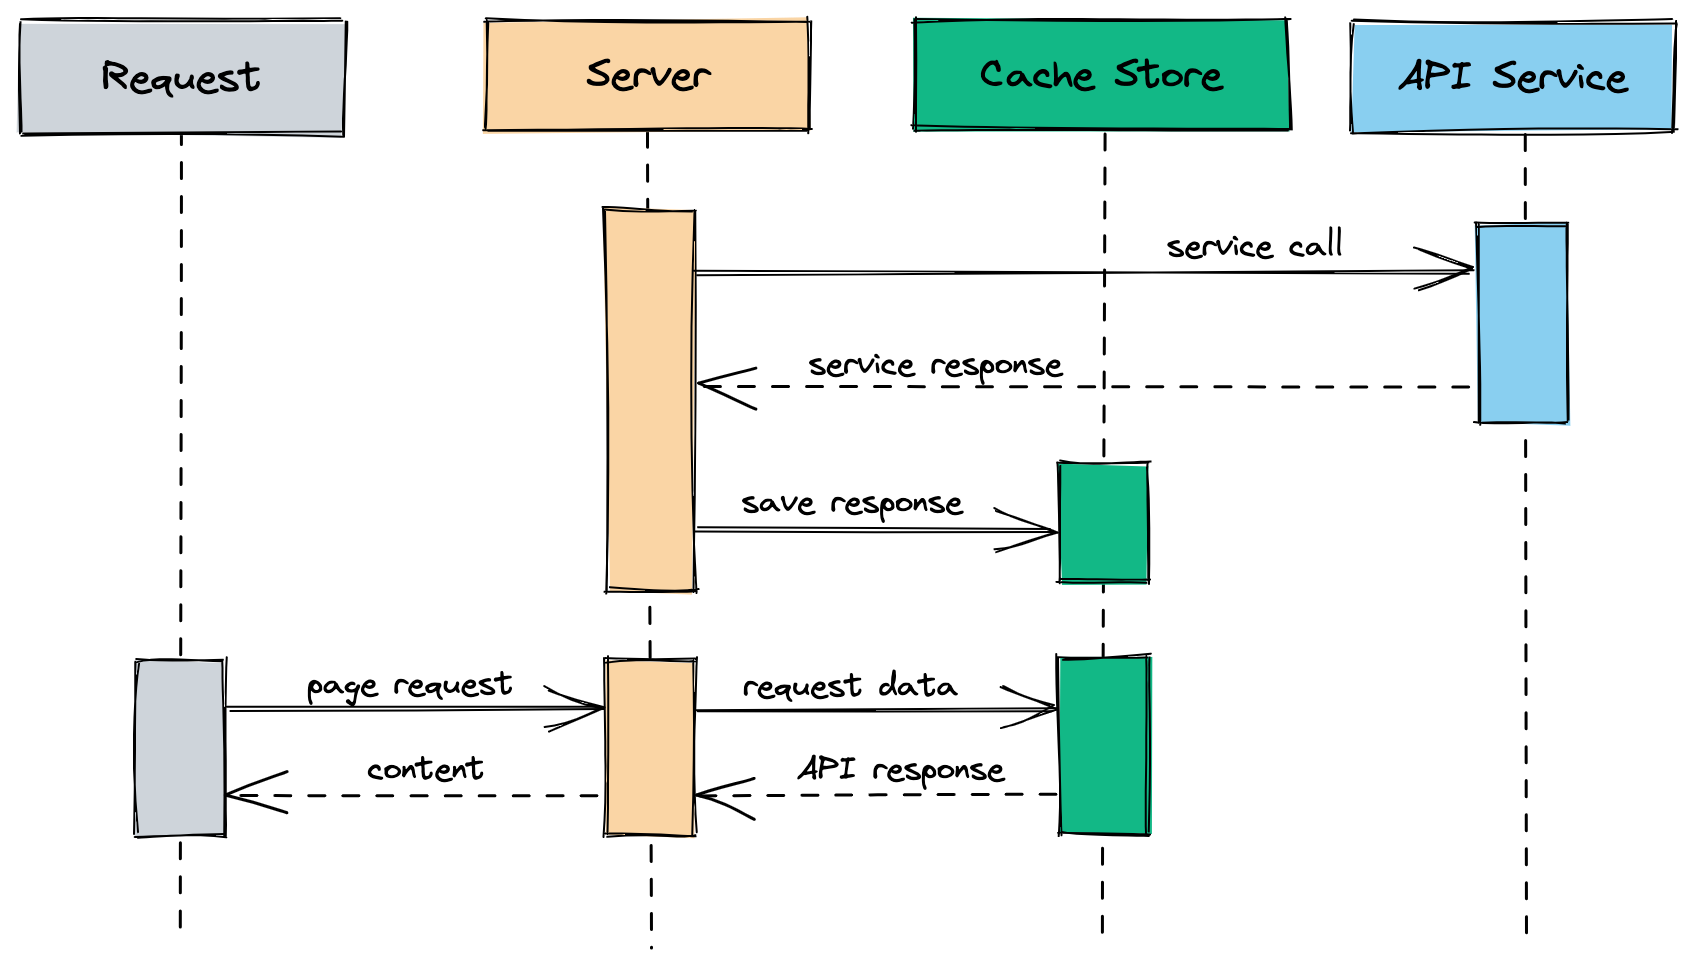
So instead of saving it in memory let’s use a shared store like Redis, so any instance that is spawned, instead of fetching data on boot and every hour, it consumes data from the store.
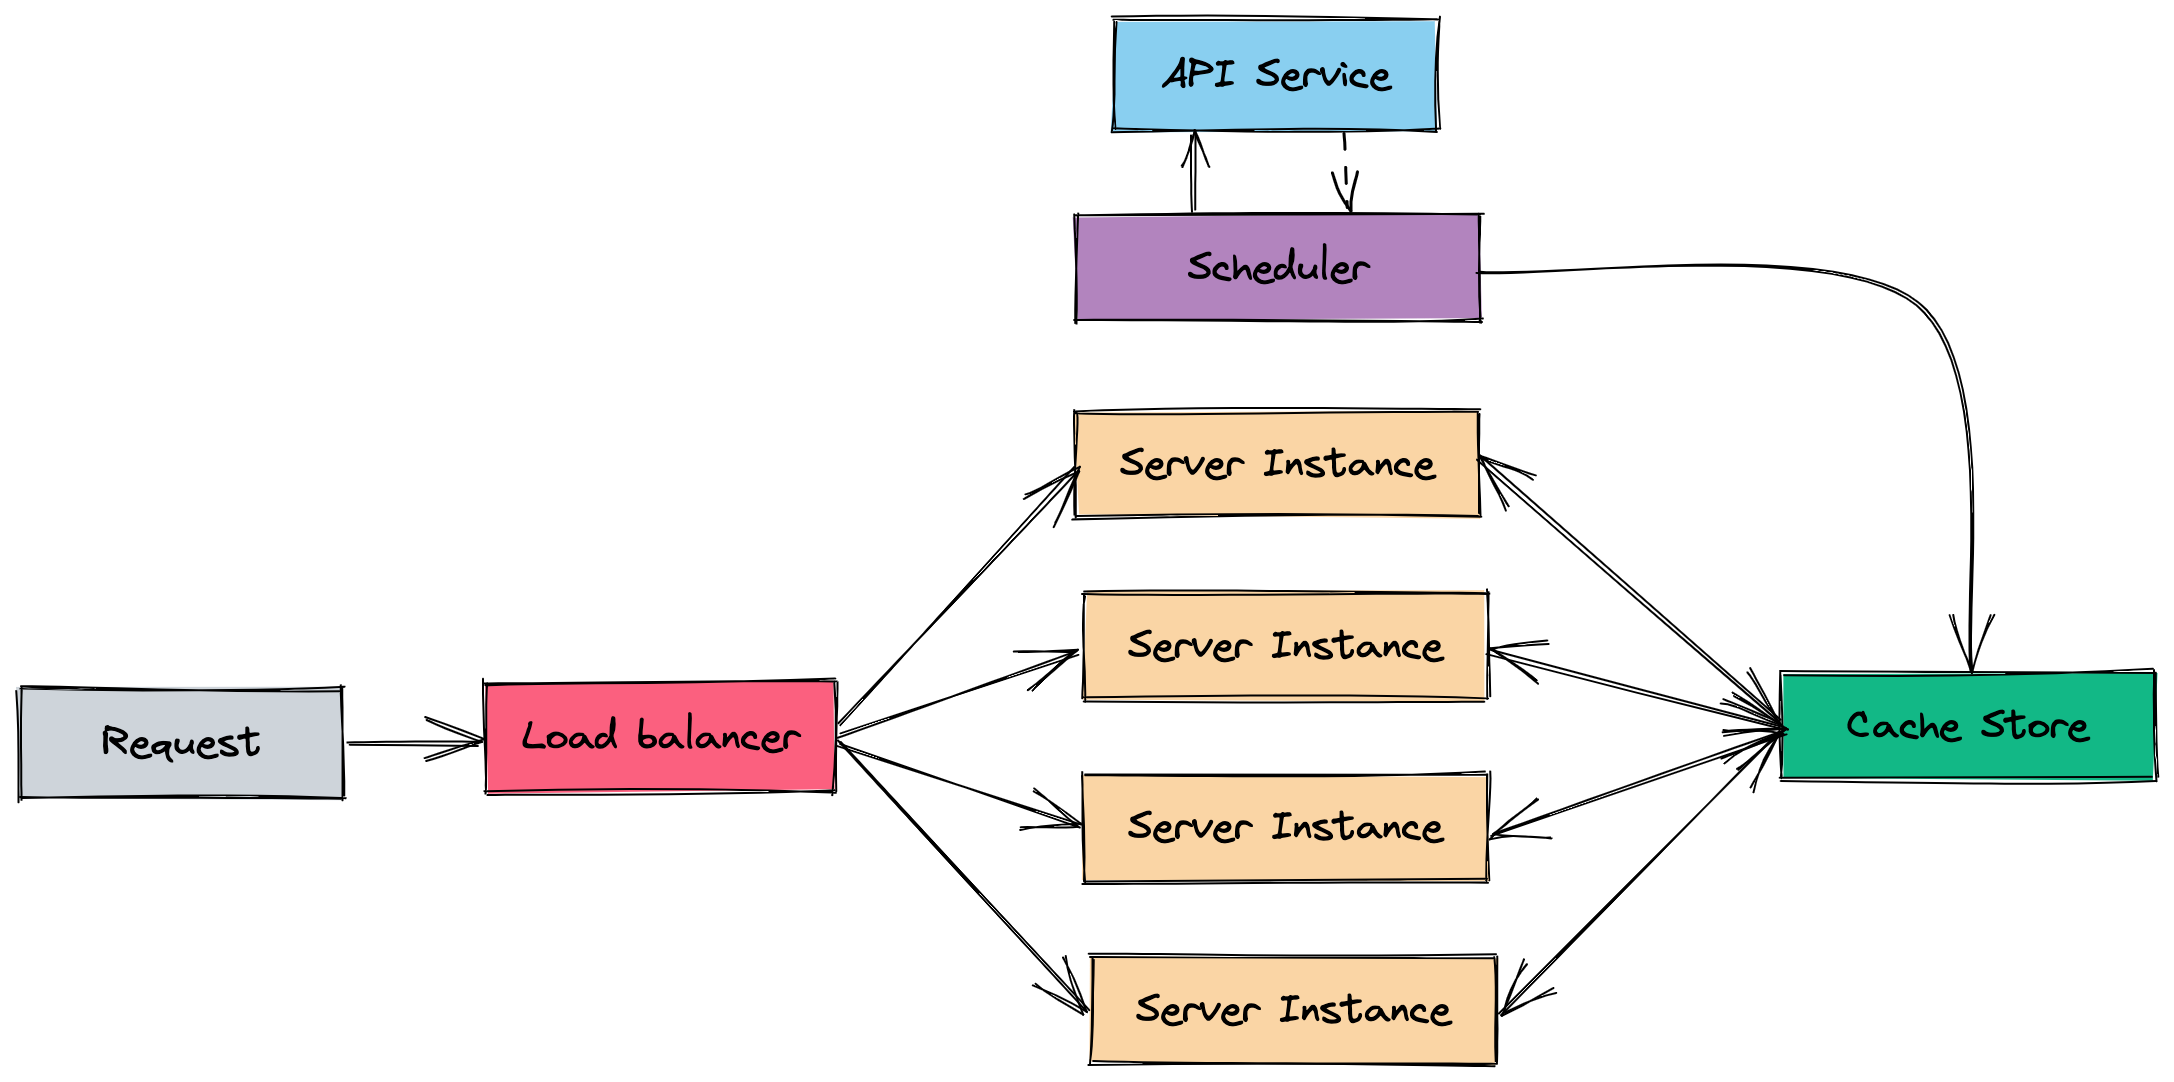
In a special instance, let’s call it a scheduler, we run the background job only once. So now it doesn’t matter how many instances you spawn, your bill or API calls will remain the same.
But what if?
What if the instance is spawned and the shared cache store is empty?
What if the shared cache store is down?
What if the update process fails and there is no safeguard to regenerate the cache?
Cursed. And that’s what happened with this bug.
In my opinion, safeguards are nice, but also cursed; you can put so many safeguards to ensure edge cases but in the end, the implementations that you make can also have bugs. So it’s not that rare to find safeguards over safeguards in code, excessive monitoring, or backup strategies that are never going to be used.
The debug diary
At 12:30 we released a feature and everything went great. Good performance, correct functionality, and it seemed that was it.
At 14:01 we received several alerts from our ping services, including our DevOps wizard: latency was increasing like hell, and a big spike on read and write ops was happening in one of our cache stores. This was about to bring us down. We immediately jumped into a call.
At 14:04 it was all gone: the latency was normal again, and the application was healthy. It was like nothing happened. We started digging into the latest changes and there was nothing that popped our eye except a cache change in a big component. We changed the key in order to regenerate it and we made a deployment.
We knew there was some kind of race condition given the exact time the performance started degrading, and we did not have anything else deployed in the application that was time sensitive, so there was a smell in our code.
At 14:30 the new code was deployed and everything was looking good. The cache was regenerated with the new key.
At 15:00 nothing happened. We looked at some graphs from our services and everything looked normal, but it didn’t feel good. The cache key was not the villain, it was just the obvious change, so it felt like cheating the bug out.
We commented out all our crons and started to execute them one by one manually during this one-hour window. Even though we had little evidence that the bug was still there, we wanted to run and find out what happened before the next hour.
At 16:00 we started receiving alerts like crazy, and again: spike on read and write ops on our cache-store. Something was really off, and since Latin America was waking up - a term I love to use since it’s our highest traffic - we were scared that this bug was going to bring us down.
At 16:04 it stopped again. We had looked into our schedule instance to find slow jobs that might be the culprit of our performance issue.
And then it hit us. One of the jobs was calling our exchange rate service. We dug into the logs and the stack traces and we finally found where our write and read ops were coming from.
Plot twist (?): It’s the cache
I’m pretty sure you have heard this quote:
“There are only two hard things in Computer Science: cache invalidation and naming things.”
– Phil Karlton
Also DNS. And off-by-one errors. And Computer Science jokes.
The feature we released made use of the exchange rate service in a pretty massive way, always assuming that the cache invalidation was working as expected and it was hitting our cache-store. And in fact, it was, since we were not doing round-trips to the database, and we could see in our external service calls that the endpoint was being called as planned.
When digging deeper we noticed that there were some calls made on a helper to our exchange rate service that was pretty constant. We saw peaks from months ago, and the trend was always the same: every hour, at minute zero, there was a peak in calls to the service for 4 minutes, and then it stopped until the next hour. Sounds familiar?
Here is what happened: the service was integrated and revisited at two different times, years apart, and the team responsible for the initial integration was not the same that made the revisit, so some context was lost. There were two parts that were colliding: the service itself that was in a cronjob running every hour at minute 4, and the service that wrote a TTL for one hour.

As we can see in this beautiful drawing, we have a background job that runs every hour at minute 4, and a TTL that is set by the end of the hour. This caused a safeguard to be triggered: it would go and fetch data from a backup and write the data in the cache-store. This happened with each call of the service which is used massively. These fetch and write data calls were happening until the cronjob kicked in, writing the data and resetting the TTL.
But why didn’t it happen every hour after the deployment? Good question! If you read the debug diary it didn’t happen at 13:00 nor at 15:00, and this is because of one of those safeguards we had: every time a deployment happened, the service would go and re-fetch the data, resetting the TTL, avoiding the 4-minute bug.
Final words
I found this bug interesting because it wasn’t until we deployed a new feature that we noticed it. In other words: It wasn’t until we tried to scale that we noticed that there was a problem.
You can’t cover everything with monitoring, nor cover every edge case with tests and safeguards, but they sure help.
I’m currently building software that is scaling crazy fast, we have more hands, more traffic, and more features, and I’m pretty sure I will have an interesting story soon. Make sure to stay tuned!